-
Prometheus Metric Type24년 11월 이전/Metric 2021. 4. 9. 22:42반응형

개요
Prometheus에서 메트릭을 수집하는 방법은 대표적으로 크게 2가지가 있다.참고! 메트릭이란?
메트릭이란 수집하는 시계열 데이터를 일컫는 말이라고 보시면 됩니다.
- Client Library를 통한 메트릭 수집
- Exporter를 통한 메트릭 수집
위 2가지 방법 모두,
Prometheus에서 지원하는 다음의 4가지 메트릭 타입으로 각 메트릭을 정의하여 저장한다.- Counter
- Gauge
- Summary
- Histogram
보통 모니터링 상황에서는
Exporter를 이용해서, 각 메트릭을 수집하는 것이 일반적이지만, 이번 장에서는Prometheus의 메트릭 타입을 살펴보기 위해서,Golang기반의Client Library를 이용하여, 메트릭을 수집해 볼 것이다.코드는 다음에서 확인할 수 있다.
참고! 이 장을 시작하기 전에...
이 장을 시작하기 전에, Docker와 docker-compose가 로컬 머신에 반드시 설치가 필요합니다!
프로젝트 구조와 설정
프로젝트의 구조는 다음과 같다.
|- ch03
    |- config
        |- prometheus.yml
    |- .gitignore
    |- Dockerfile
    |- docker-compose.yml
    |- go.mod
    |- go.sum
    |- main.go
먼저
Golang기반의 간단한 애플리케이션이 작성된 것을 확인할 수 있다.part1/ch03/main.go
package main

import (
    "fmt"
    "html"
    "net/http"
    "time"

    "github.com/prometheus/client_golang/prometheus"
    "github.com/prometheus/client_golang/prometheus/promauto"
    "github.com/prometheus/client_golang/prometheus/promhttp"
)

var (
    COUNTER = promauto.NewCounter(prometheus.CounterOpts{
        Name: "hello_world_total",
        Help: "Hello World requested",
    })

    GAUGE = promauto.NewGauge(prometheus.GaugeOpts{
        Name: "hello_world_connection",
        Help: "Number of /gauge in progress",
    })

    SUMMARY = promauto.NewSummary(prometheus.SummaryOpts{
        Name: "hello_world_latency_seconds",
        Help: "Latency Time for a request /summary",
    })

    HISTOGRAM = promauto.NewHistogram(prometheus.HistogramOpts{
        Name:    "hello_world_latency_histogram",
        Help:    "A histogram of Latency Time for a request /histogram",
        Buckets: prometheus.LinearBuckets(0.1, 0.1, 10),
    })
)

func index(w http.ResponseWriter, r *http.Request) {
    COUNTER.Inc()
    fmt.Fprintf(w, "Hello, %q", html.EscapeString(r.URL.Path))
}

func gauge(w http.ResponseWriter, r *http.Request) {
    GAUGE.Inc()
    defer GAUGE.Dec()
    time.Sleep(10 * time.Second)
    fmt.Fprintf(w, "Gauge, %q", html.EscapeString(r.URL.Path))
}

func summary(w http.ResponseWriter, r *http.Request) {
    start := time.Now()
    defer SUMMARY.Observe(float64(time.Now().Sub(start)))
    fmt.Fprintf(w, "Summary, %q", html.EscapeString(r.URL.Path))
}

func histogram(w http.ResponseWriter, r *http.Request) {
    start := time.Now()
    defer HISTOGRAM.Observe(float64(time.Now().Sub(start)))
    fmt.Fprintf(w, "Histogram, %q", html.EscapeString(r.URL.Path))
}

func main() {
    http.HandleFunc("/", index)
    http.HandleFunc("/gauge", gauge)
    http.HandleFunc("/summary", summary)
    http.HandleFunc("/histogram", histogram)
    http.Handle("/metrics", promhttp.Handler())
    http.ListenAndServe(":2112", nil)
}
코드 설명은 차차 하기로 하고, 여기서 중요한 것은 이
Golang코드는Prometheus Client Library의존성이 있다는 것이다. 이를 위해서,go.mod,go.sum이 생성되어 있으며,Dockerfile을 통해서, 이 애플리케이션이 도커 이미지로 만들어진다.그리고,
docker-compose.yml을 보자.part1/ch03/docker-compose.yml
version: "3"

services:
  app:
    container_name: app
    build: .
    ports:
      - 2112:2112

  prometheus:
    container_name: prometheus
    image: prom/prometheus:latest
    ports:
      - 9090:9090
    command:
      - '--config.file=/etc/prometheus/prometheus.yml'
      - '--storage.tsdb.path=/prometheus'
      - '--web.console.libraries=/usr/share/prometheus/console_libraries'
      - '--web.console.templates=/usr/share/prometheus/consoles'
    volumes:
      - ./config/prometheus.yml:/etc/prometheus/prometheus.yml
여기서 작성된 도커 이미지 기반으로
app이라는 컨테이너를 1개 생성하고 로컬 머신에 포트 2112번에 매핑시킨다. 또한Proemtheus컨테이너도 1개 생성한 후,config/prometheus.yml기반으로Prometheus가 동작할 수 있도록 설정되어 있다. 역시 9090번에 매핑되어 있다.Prometheus설정을 잠깐 살펴보자.part1/ch03/config/prometheus.yml
# my global config
global:
  scrape_interval:     15s # By default, scrape targets every 15 seconds.
  evaluation_interval: 15s # By default, scrape targets every 15 seconds.

  external_labels:
    monitor: 'my-project'

rule_files:
  # ...
scrape_configs:
  - job_name: 'prometheus'
    scrape_interval: 5s

    static_configs:
      - targets: ['localhost:9090']

  - job_name: 'app'
    scrape_interval: 5s

    static_configs:
      - targets: ['app:2112']
위 설정 파일은
Prometheus로 하여금 자신과,app의 "/metrics" 엔드포인트에서 수집할 수 있는 메트릭을 5초에 1번씩 수집하게 한다.Proemtheus에서는scrape_interval주기로 메트릭을 수집하는 단위를job이라고 한다.이제 잘 구성이 되어 있나 확인해보자. 먼저 터미널에 다음을 입력하여, 도커 컨테이너들을 만든다.
# 현재 위치 확인 ch03이 있는 곳으로 가야 함.
$ pwd
/Users/gurumee/Workspace/gurumee-prometheus-code/part1/ch03

# docker 컨테이너 구동
$ docker-compose up --build -d
약간의 시간 후 브라우저에서 "localhost:2112/metrics"를 접속해본다. 그럼 다음 화면이 보인다.
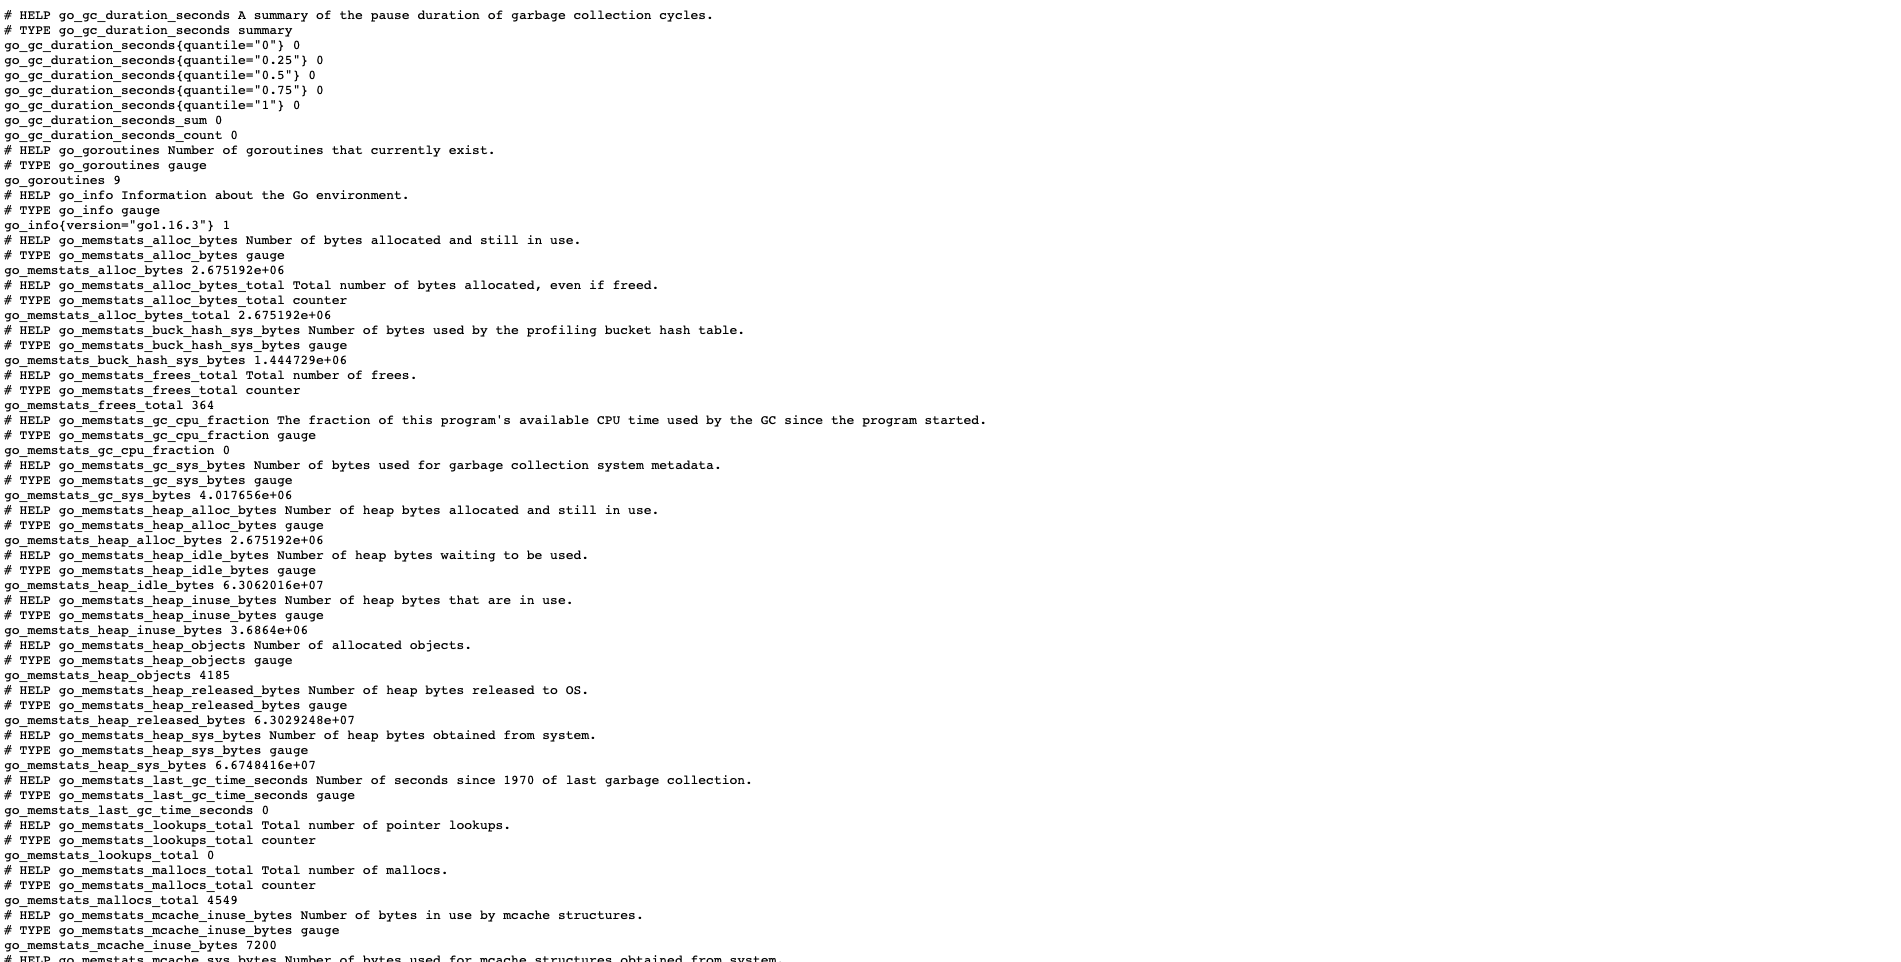
위 화면은 우리가
Golang기반의 애플리케이션으로,Prometheus Client Library를 이용하여, "/metrics" 경로에 수집할 수 있는 여러 메트릭들을 노출시키고 있다.Prometheus는 이 경로를 통해서 노출된 메트릭을 수집하는 것이다. 이제 "localhost:9090"에 접속해보자.
검색 쿼리 창에 "up"이란 명령어를 쳐보자. 그럼 다음 결과가 보일 것이다.
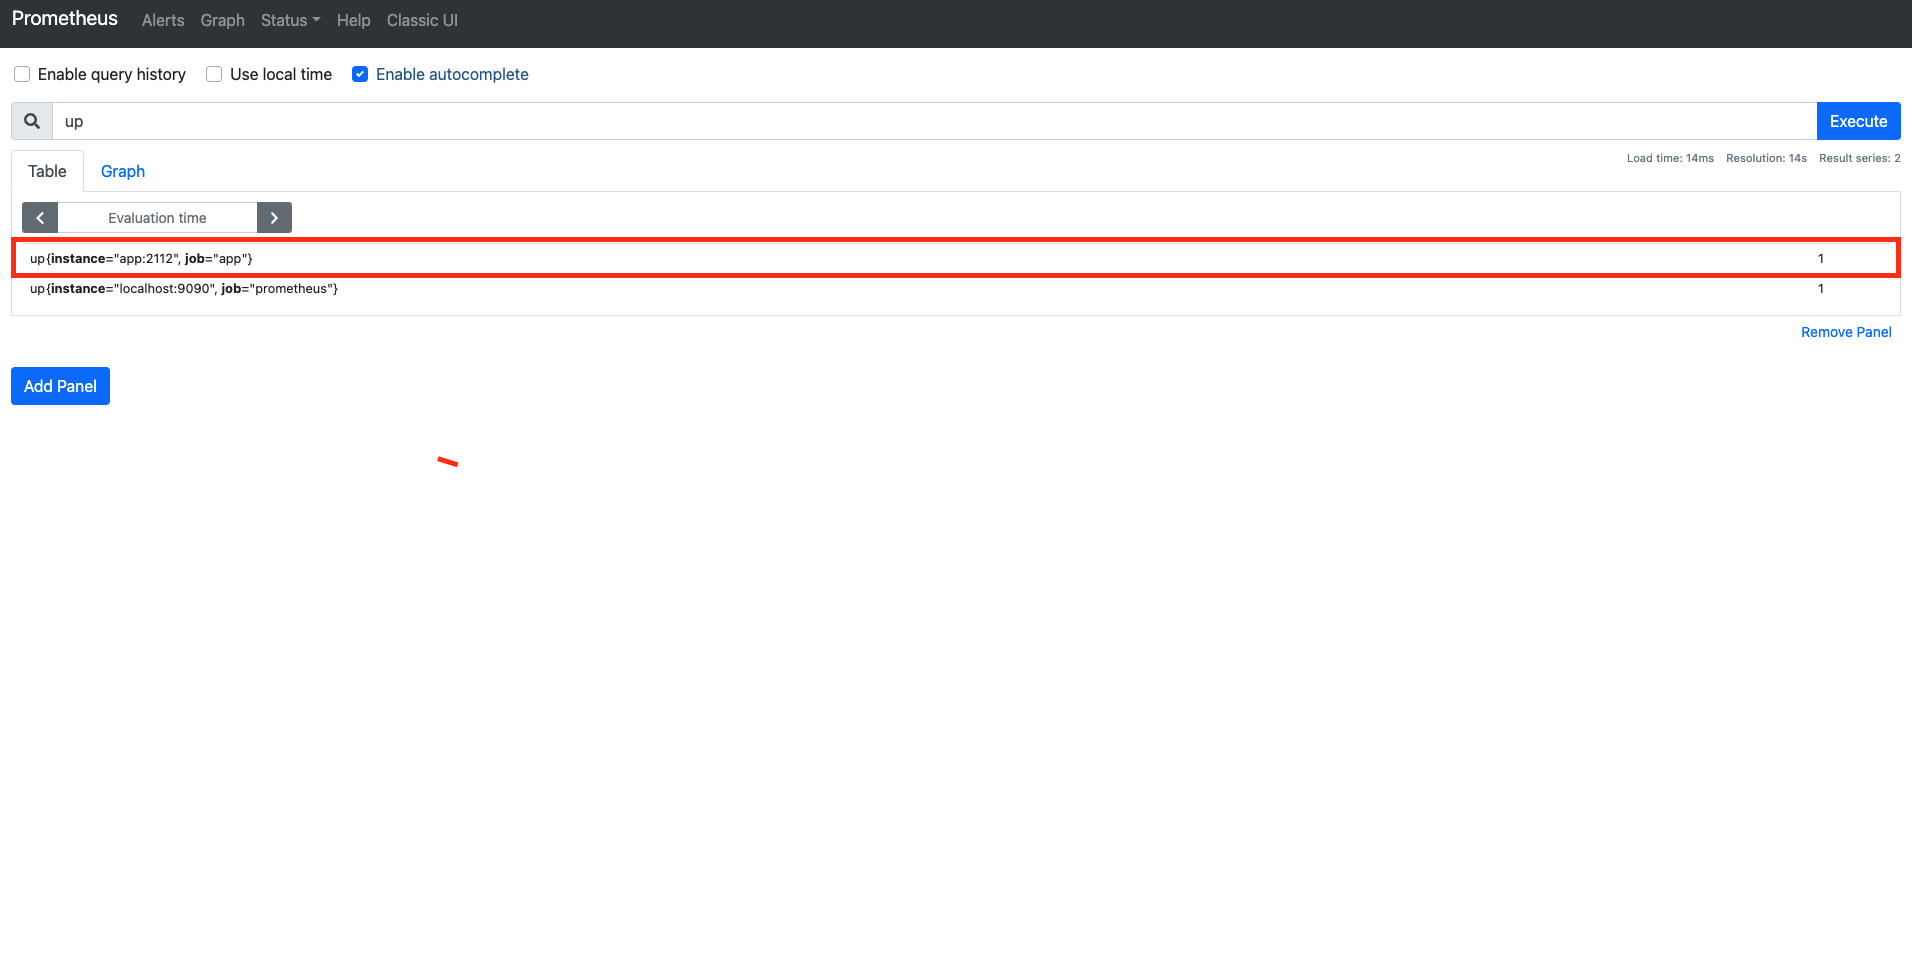
"up" 쿼리는
Prometeus에서 설정한job이 잘 돌고 있는지 확인할 수 있는 쿼리이다. 위에서 보면 우리가 설정한job2개였던 "app", "prometheus"가 1임을 확인할 수 있다.이제 아래 명령어를 실행하여서 "app" 컨테이너를 죽여보자.
$ docker-compose stop app그 후 다시 브라우저에서 "up" 쿼리를 실행해보자. "app"이 0이 됨을 확인할 수 있다. 즉 "up" 쿼리는
job이 정상적으로 동작하고 있으면 1을 비정상적이면 0을 결과로 보여준다.
다시 다음 명령어를 통해서 "app" 컨테이너를 재구동한다.
$ docker-compose up -d app코드를 작성하며 알아보는 Prometheus 메트릭 타입
앞 절에서 언급했 듯이,
Prometheus에서는Counter,Gauge,Summary,Histogram이라는 4가지 메트릭 타입이 존재한다. 코드와 함께 살펴보면서, 어떤 특성들이 있는지 확인해보자.Counter
Counter타입은 가장 많이 수집되는 유형의 메트릭 타입이다. 이 타입은 모니터링하는 이벤트의 누적 개수 혹은 크기를 표현한다. 일반적으로 이 타입은rate함수와 같이 사용하여, 다음 이벤트를 추적하는데 많이 사용된다.- 초당 요청 개수
- 초당 상태 코드 개수
- 초당 요청 실패율
- 초당 요청 성공률
위 애플리케이션에서
Counter타입에 대한 부분은 다음과 같다.part1/ch03/main.go
package main

import (
    // ...

    "github.com/prometheus/client_golang/prometheus"
    "github.com/prometheus/client_golang/prometheus/promauto"
    "github.com/prometheus/client_golang/prometheus/promhttp"
)

var (
    COUNTER = promauto.NewCounter(prometheus.CounterOpts{
        Name: "hello_world_total",
        Help: "Hello World requested",
    })
    // ...
)

func index(w http.ResponseWriter, r *http.Request) {
    COUNTER.Inc()
    fmt.Fprintf(w, "Hello, %q", html.EscapeString(r.URL.Path))
}

// ...

func main() {
    http.HandleFunc("/", index)
    // ...
}
간단히 애플리케이션에 대해 말하자면, 애플리케이션에서 "/"가 호출될 때마다 "index" 함수가 호출되어 전역 변수
COUNTER의 개수가 증가하게 된다.
위 그림을 잘 보면, 코드에서 설정했던
Name,Help가 메트릭 이름과 주석에 대한 설명으로 값이 할당 된 것을 확인할 수 있다. 또한 이름 옆에 숫자가 보이는데, 이것이 바로 메트릭의 값이다. 이것은 누적 숫자로써, "/" 경로를 타고 들어오면, 개수가 계속 증가한다.참고! "/metrics"로 해도 증가하던데요?
이거는 URL 매칭이랑 관련이 있는건데, 간단하게 말하면 특정 코드 작업이 없으면 "/"로 시작하는 URL 모두 호출되면 "index" 함수가 호출된다고 보시면 됩니다. 즉, "/abc", "/foo" 이렇게 호출해도 "index"는 호출해서 "COUNTER" 값은 증가됩니다. 원래는 이런 경우에 "label"을 붙여서 호출된 uri 전체를 나누는게 일반적입니다.
위에서 언급했듯이 보통
Counter는rate라는 내장 함수를 이용해서 많이 쓰인다.rate는Counter타입의 메트릭에 대해서 특정 시간 범위에 대해서 초당 평균 개수를 나타내는 함수이다. 만약 1분간 "/"에 대한 RPS를 알고 싶다면 다음과 같이 쿼리할 수 있다.rate(hello_world_total[1m])위 쿼리 결과를
Prometheus UI에서 그래프로 시각화하면 다음과 같은 그림이 보인다.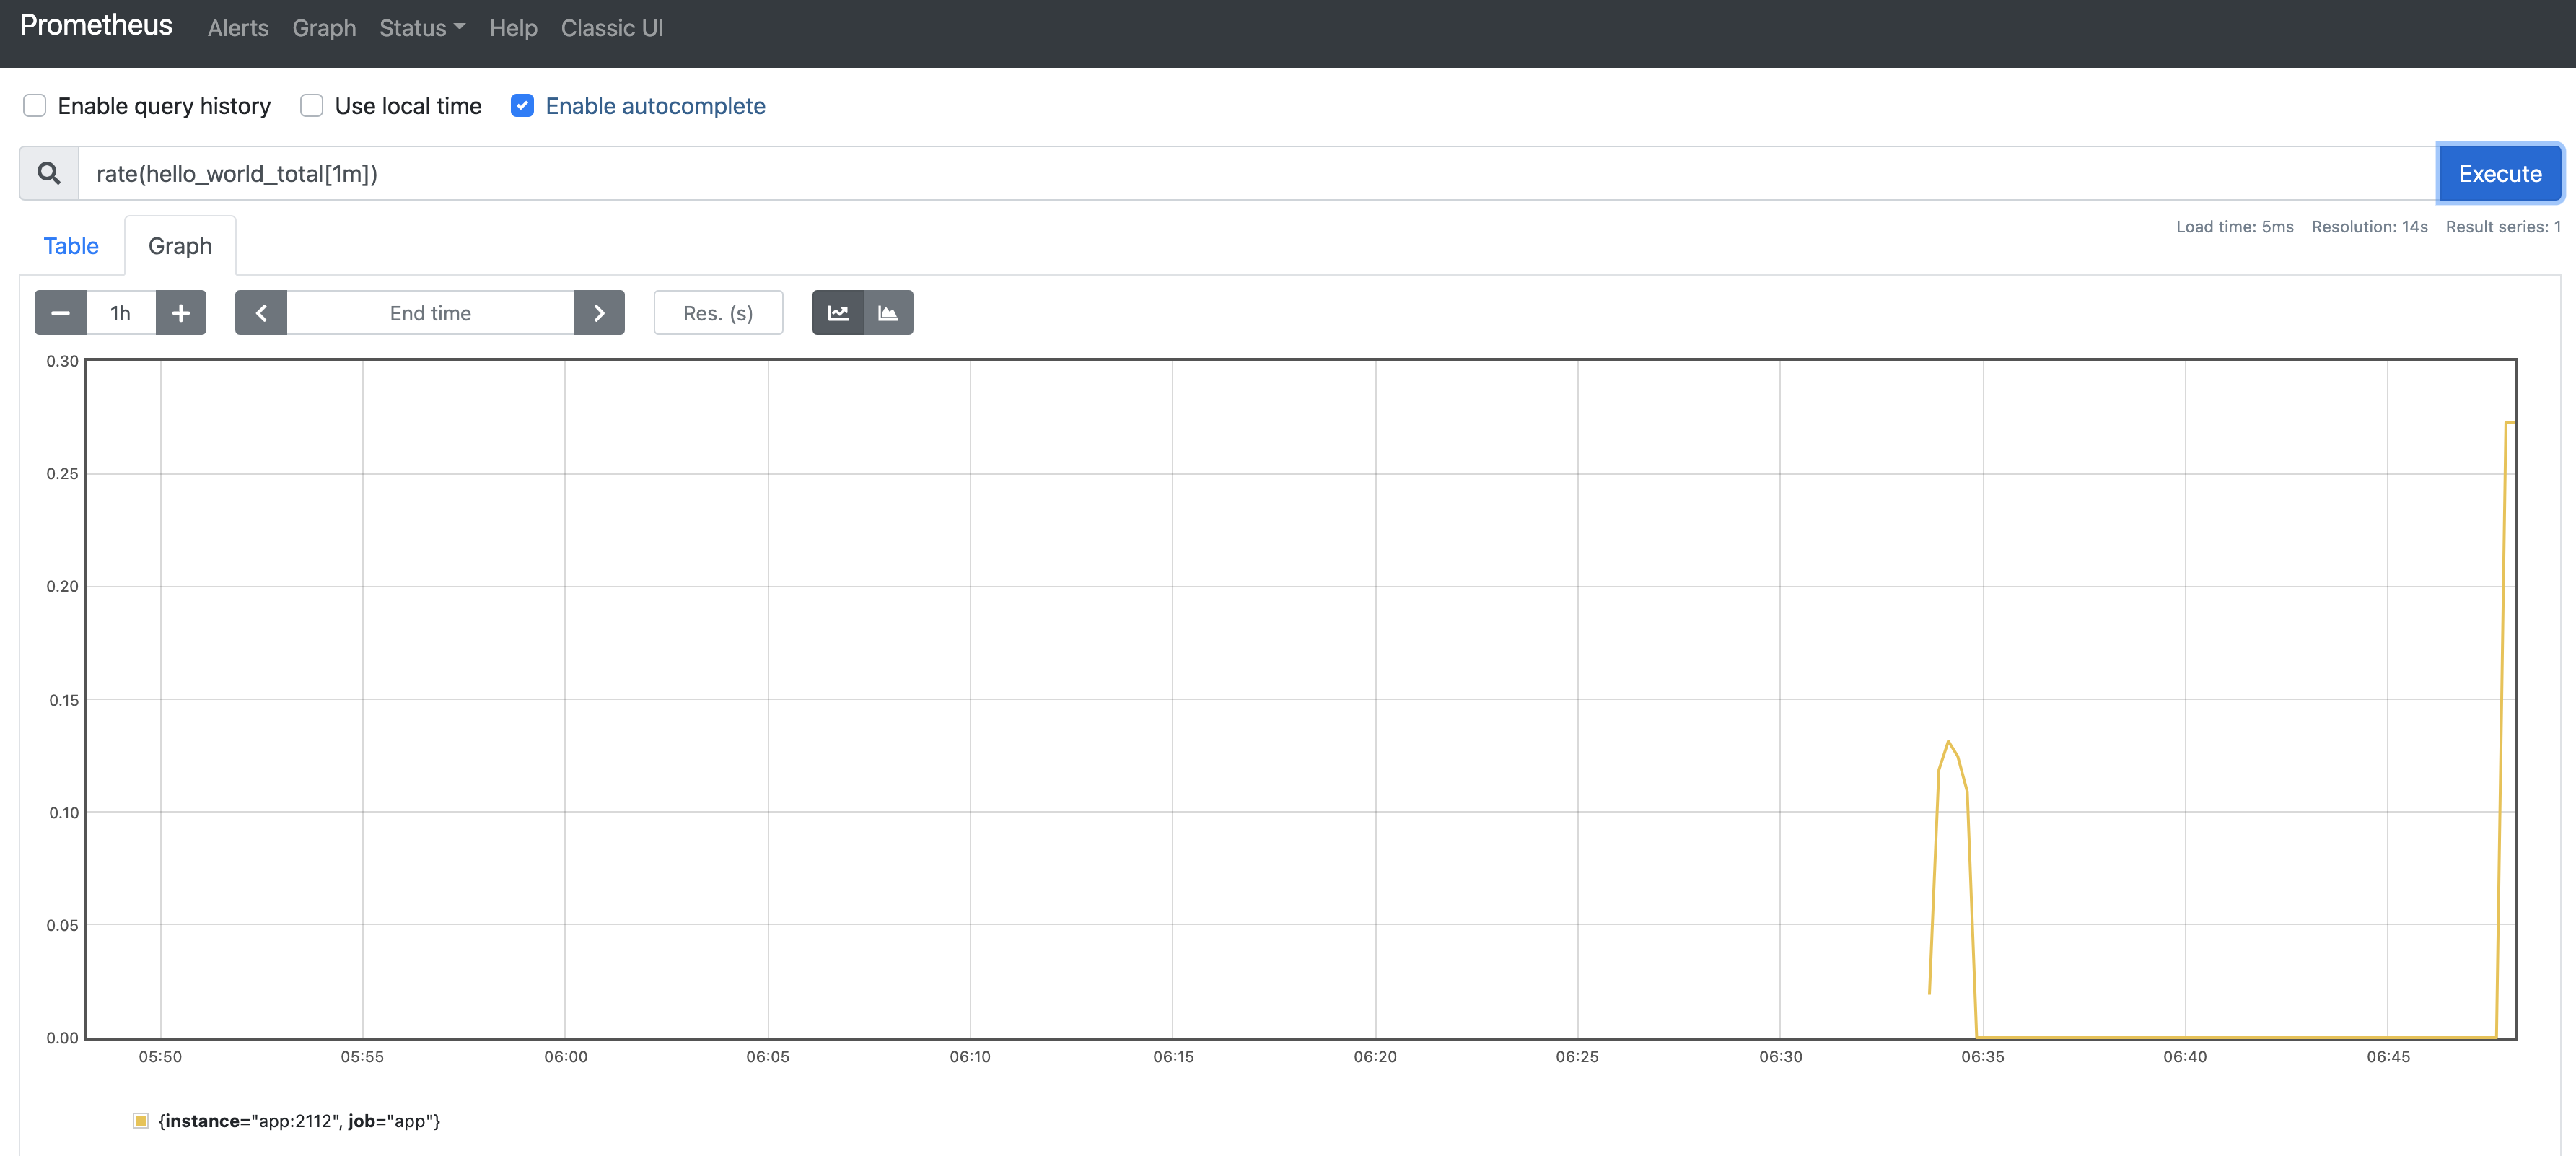
참고! RPS란
Request Per Second의 약자로써, 초당 요청 개수를 뜻합니다. 일반적으로 RPS 외에 상태 코드 개수 등의 메트릭을 추적하는데, Counter 타입을 쓰게 됩니다.
Counter타입을 쓸 때 주의 사항은 다음과 같다.- 누적 개수로써 이벤트 개수에 대해서 오로지 증가만 가능하다.
- 애플리케이션이 재구동되면 0이된다. (사실 이건 Prometheus 모든 타입에 적용되는 사항이다.)
Gauge
Gauge타입은 "현재 상태"를 표현하는 메트릭 타입이다.Counter타입과 달리 증가도 가능하고 감소도 가능하다. 이 타입의 예는 다음과 같다.- 현재 커넥션 개수
- 현재 동작하는 스레드 개수
- 현재 메모리 사용량
- 업타임 시간
관련 코드는 다음과 같다.
part1/ch03/main.go
package main

import (
    // ...
    "time"
    // ...
    "github.com/prometheus/client_golang/prometheus"
    "github.com/prometheus/client_golang/prometheus/promauto"
    "github.com/prometheus/client_golang/prometheus/promhttp"
)

var (
    // ...

    GAUGE = promauto.NewGauge(prometheus.GaugeOpts{
        Name: "hello_world_connection",
        Help: "Number of /gauge in progress",
    })

    // ...
)

// ...

func gauge(w http.ResponseWriter, r *http.Request) {
    GAUGE.Inc()
    defer GAUGE.Dec()
    time.Sleep(10 * time.Second)
    fmt.Fprintf(w, "Gauge, %q", html.EscapeString(r.URL.Path))
}

// ...

func main() {
    // ...
    http.HandleFunc("/gauge", gauge)
    // ...
}
역시 간단하게 설명하자면 "/gauge" 엔드포인트 접속 시,
GAUGE를 1 늘린다. 그 후 10초동안 잠들고, 요청 처리가 끝나면,GAUGE를 1 감소 시킨다. 즉, 10초동안GAUGE가 유지될 것이며 동시에 여러 명에게 요청된다면 현재 요청 처리되는 개수를 알 수 있을 것이다.실제로 "localhost:2112/gauge"를 여러번 요청 후에
Prometheus UI에서 다음 쿼리를 쳐보자.hello_world_connection위 쿼리를 그래프로 보면 다음과 같다.
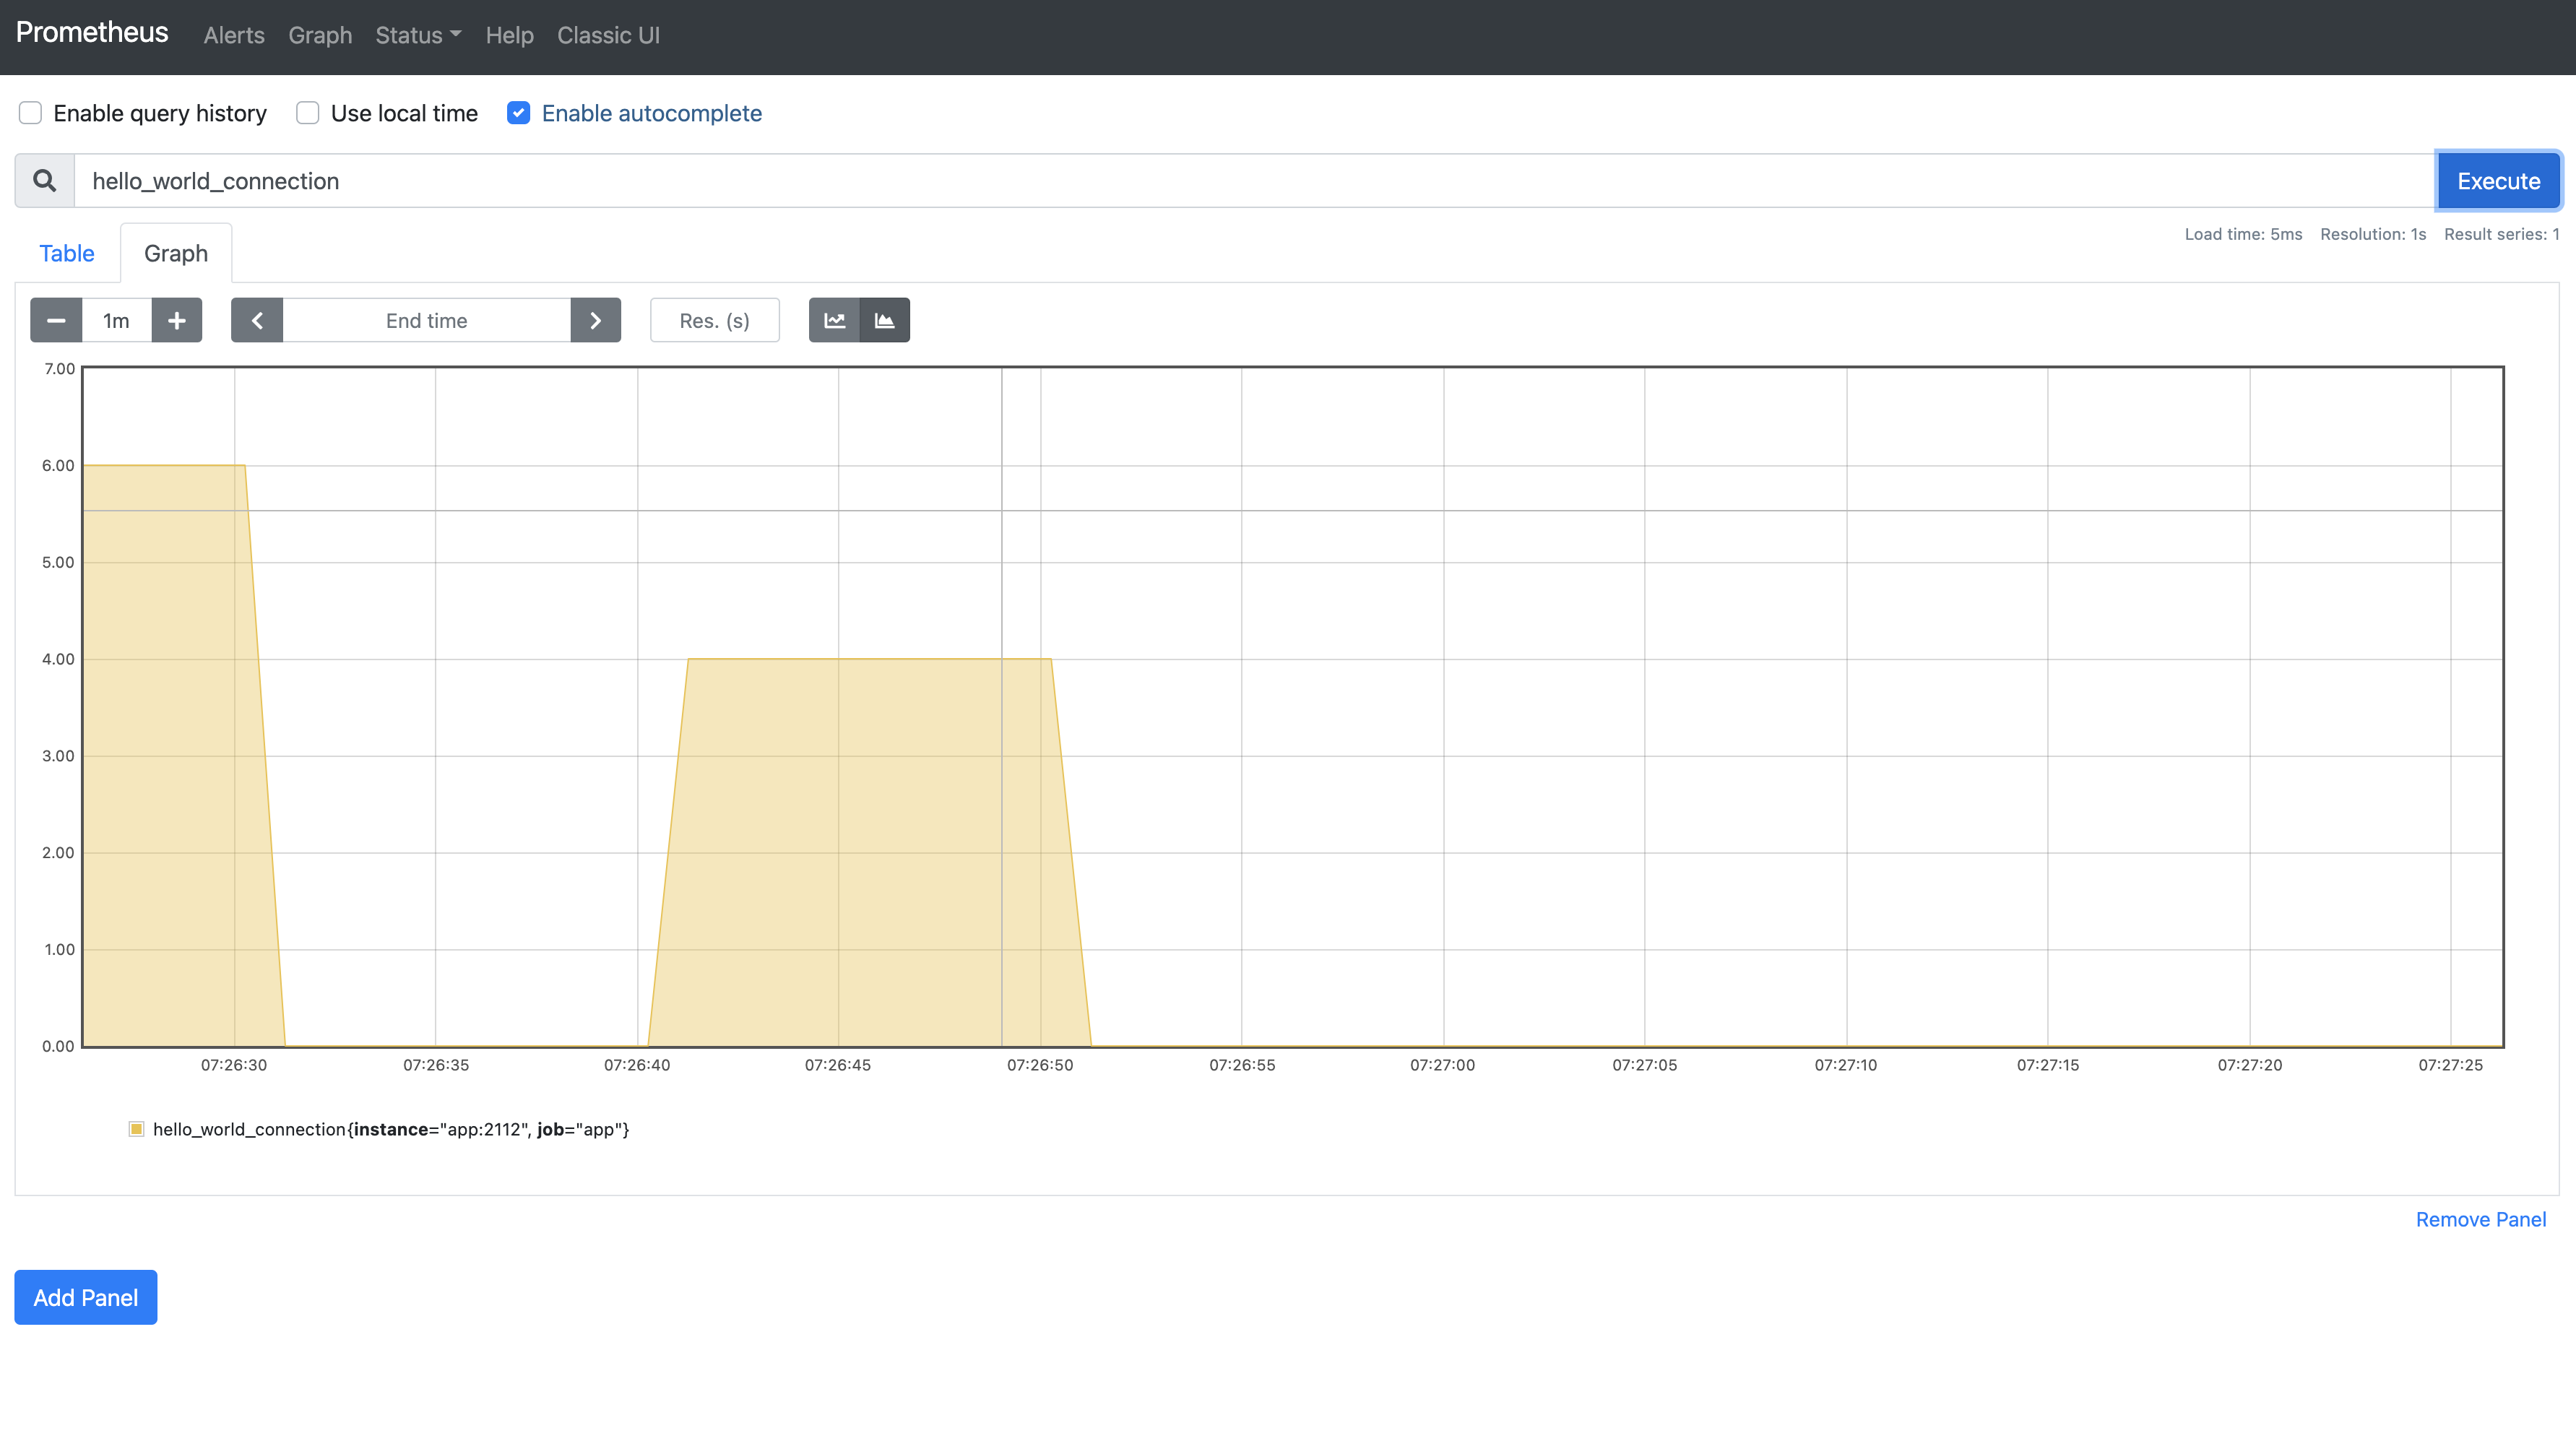
실제로
hello_world_inprogress가 10초 정도 값이 유지되다가 떨어지는 것을 확인할 수 있다. 보통Gauge타입은 위처럼 그래프로 시각화하기보단 게이지 타입으로 시각화하는 것이 일반적이다. 하지만Prometeus UI에서는 이를 지원하지 않는다. 추후 진행되는 모니터링 실습에서Grafana라는 시각화 도구를 보게 될 것이다. 그 때, 한번 더 살펴보기로 하자.또한
Gauge는 현재 상태를 표현하기에 일반적으로 그냥 메트릭 이름으로 쿼리하게 된다. 대표적으로 "up" 같은 메트릭이 이 타입이다. 참고적으로Counter타입에rate함수를 적용하면Gauge타입으로 변환된다는 것을 알아두자.Summary
Summary타입은 시스템 성능을 이해할 때 필요한 메트릭들을 표현한다. 이 타입의 예는 다음과 같다.- 지연 시간
- 응답 시간
참고! 지연 시간(latency time) vs 응답 시간(response time)?
latency time과 response time은 시스템 성능 관련 대표적인 메트릭들입니다. 일반적으로는 동의어로 취급되지만 response time이 조금 더 포괄적인 의미로 많이 사용됨을 알아주셨으면 좋겠습니다.
관련 코드는 다음과 같다.
part1/ch03/main.go
package main

import (
    // ...
    "time"
    // ...
    "github.com/prometheus/client_golang/prometheus"
    "github.com/prometheus/client_golang/prometheus/promauto"
    "github.com/prometheus/client_golang/prometheus/promhttp"
)

var (
    // ...

    SUMMARY = promauto.NewSummary(prometheus.SummaryOpts{
        Name: "hello_world_latency_seconds",
        Help: "Time for a request /summary",
    })

    // ...
)

// ...

func summary(w http.ResponseWriter, r *http.Request) {
    start := time.Now()
    defer SUMMARY.Observe(float64(time.Now().Sub(start)))
    fmt.Fprintf(w, "Summary, %q", html.EscapeString(r.URL.Path))
}

// ...

func main() {
    // ...
    http.HandleFunc("/summary", summary)
    // ...
}
간단하게 설명하면, "/summary" 호출 시점부터 처리 시점까지 시간을 재서, 메트릭을 수집한다.
Summary타입은 메트릭에_count,_sum이라는 접미어 붙는다.이름처럼, 시간동안 발생한 개수와 총합을 구한다. 이를 통해 평균 지연 시간을 구할 수 있다.
Prometheus UI에서, 다음 쿼리를 입력해보자.rate(hello_world_latency_seconds_sum[1m]) / rate(hello_world_latency_seconds_count[1m])이를 그래프로 시각화하면 다음과 같다.

1분 동안 평균 86ms 정도 지연 시간이 걸린 것을 확인할 수 있다. 일반적으로
Summary타입은 뒤에 나올Histogram과 매우 유사한데 이 둘을 잘 구분해서 사용해야 한다.Histogram
Histogram은Summary랑 비슷한데, "분위수"에 대한 개념이 추가된다. 이는 각 사용자 경험에 대해 추론할 때 매우 유용하게 쓰인다. (예는Summary와 같다.)관련 코드는 다음과 같다.
part1/ch03/main.go
package main

import (
    // ...
    "math/rand"
    // ...

    "github.com/prometheus/client_golang/prometheus"
    "github.com/prometheus/client_golang/prometheus/promauto"
    "github.com/prometheus/client_golang/prometheus/promhttp"
)

var (
    // ...
    HISTOGRAM = promauto.NewHistogram(prometheus.HistogramOpts{
        Name:    "hello_world_latency_histogram",
        Help:    "A histogram of Latency Time for a request /histogram",
        Buckets: prometheus.LinearBuckets(0.1, 0.1, 10),
    })
)

// ...

func histogram(w http.ResponseWriter, r *http.Request) {
    start := time.Now()
    defer HISTOGRAM.Observe(float64(time.Now().Sub(start)))
    fmt.Fprintf(w, "Histogram, %q", html.EscapeString(r.URL.Path))
}

func main() {
    // ...
    http.HandleFunc("/histogram", histogram)
    // ...
}
코드 역시
Summary타입과 비슷하다. 다만 결과값으로 분위수에 해당하는_bucket이라는 접미어가 붙은 메트릭이 추가적으로 수집된다.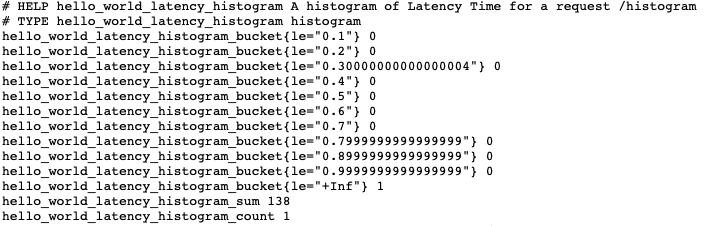
역시
Prometheus UI에서 다음 쿼리를 입력해서, 평균적인 지연 시간을 계산할 수 있다.rate(hello_world_latency_histogram_sum[1m]) / rate(hello_world_latency_histogram_count[1m])시각화하면 평균적으로 81ms로 거의 비슷한 지연시간을 얻을 수 있다.

그렇다면,
Summary와Histogram중 어떤 것을 선택해야 할까? 공식 문서에 따르면 다음을 따르도록 권장하고 있다.- 만약 집계가 필요하다면,
Histogram타입을 써라. - 또한 관찰 될 값의 범위와 분포에 대한 아이디어가 있으면
Histogram을 써라. - 그 외에는
Summary타입을 써라.
728x90반응형'레거시 > Metric' 카테고리의 다른 글
prometheus.yml 환경 변수 이용해서 동적으로 설정하기 (0) 2021.04.17 Prometheus Label (0) 2021.04.16 Cortex란 무엇인가 (2) 2021.03.23 프로세스 포트 모니터링하기 (1) blackbox-exporter (1) 2021.03.19 웹 서버 모니링하기 (1) nginx-prometheus-exporter (0) 2021.03.08