-
시스템 메트릭 모니터링하기 (1) node-exporter24년 11월 이전/Metric 2021. 2. 25. 21:20반응형

개요
이 문서에서는
Grafana,Prometheus,node-exporter를 이용해서 시스템 메트릭을 모니터링할 수 있는 대시보드를 구축하는 것에 대하여 다룬다. 자세한 내용은 다음과 같다.- node-exporter란 무엇인가
- node-exporter 설치
- node-exporter, Prometheus 연동
- 시스템 메트릭 모니터링을 위한 Grafana 대시보드 구축
이 문서에서 진행되는 실습 코드는 편의성을 위해 로컬
Docker환경에서 진행되나, 실세 서버 환경에서도 거의 동일하게 적용할 수 있도록 작성되었다. 이번 장의 코드는 다음 링크에서 확인할 수 있다.이 문서에서 구성하는 인프라스트럭처는 다음과 같다.
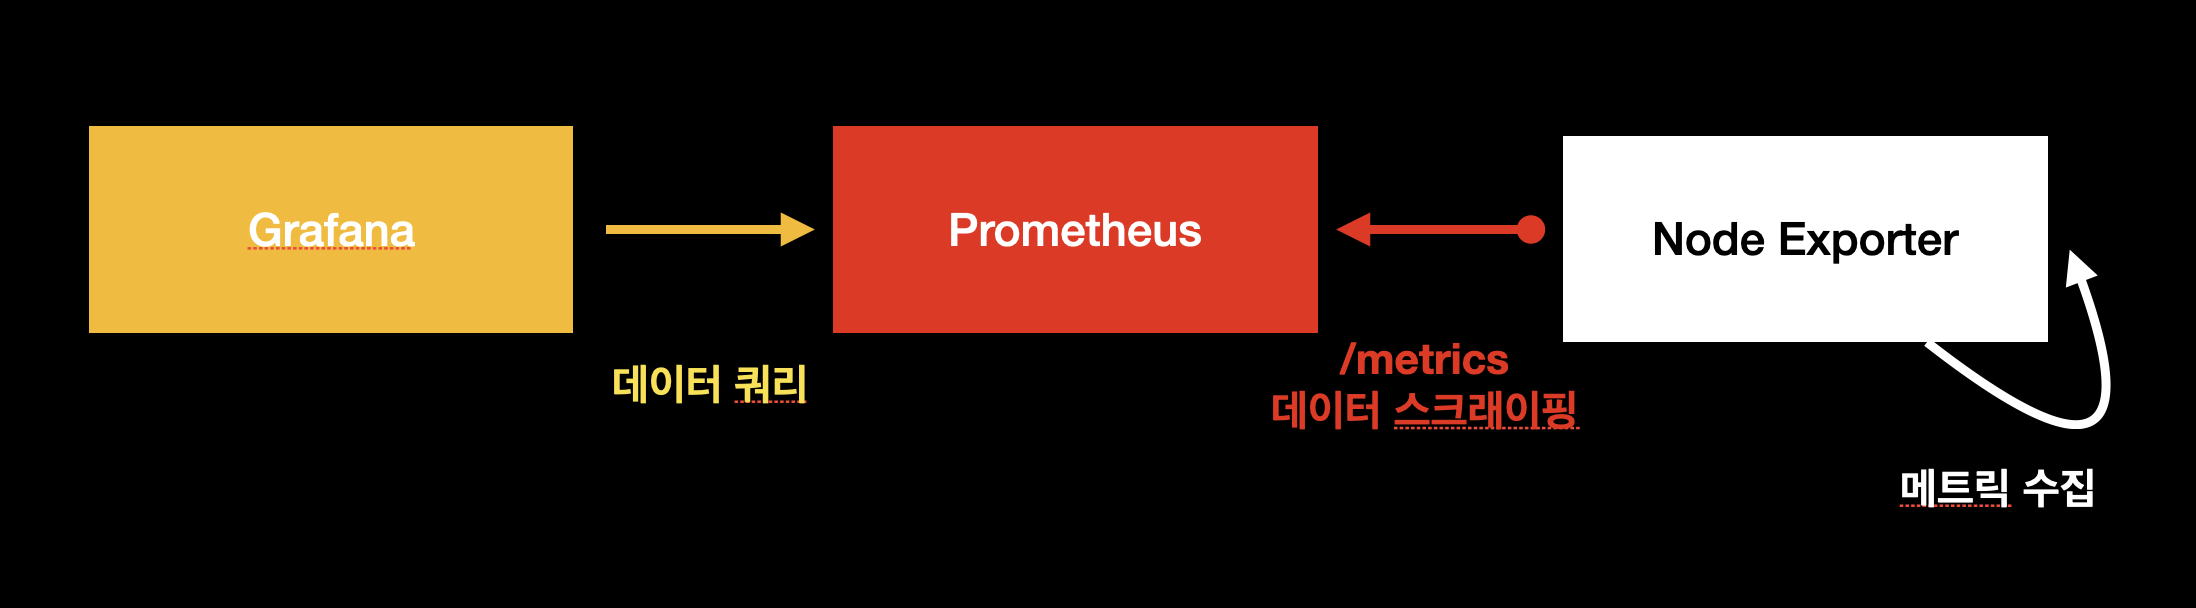
node-exporter란 무엇인가
node-exporter란 UNIX 계열 커널을 가진 하드웨어와 OS릭 등 "시스템 메트릭"을 수집하는Exporter이다.Prometheus재단이 공식적으로 지원하고 있는Exporter중 하나이며Prometheus로 모니터링 시스템을 구축 시 시스템 메트릭 수집을 위해 가장 우선적으로 고려되는Exporter이기도 하다.참고! Exporter가 무엇인가요?
Exporter란 특정 메트릭을 수집해서 엔드포인트에 노출시키는 소프트웨어 혹은 에이전트라고 보시면 됩니다. node-exporter가 UNIX 계열 서버의 cpu, memory 등의 메트릭을 수집할 수 있는 것처럼, DB, 하드웨어, 메세지 시스템, 저장소 등 여러 시스템에 대한 익스포터가 존재하며, CollectD 등 기존의 서버 모니터링에 사용되는 에이전트들과 통합할 수 있는 익스포터도 존재합니다.
node-exporter 설치 (로컬)
로컬 환경에서는
Docker로 설치를 진행한다. 터미널에 다음을 입력하여 설치할 수 있다.$ docker run --rm -p 9100:9100 prom/node-exporter그 후 새로운 터미널을 열어 다음 명령어를 입력해서 수집되는 데이터가 있는지 확인한다.
$ curl localhost:9100/metrics
# HELP go_gc_duration_seconds A summary of the pause duration of garbage collection cycles.
# TYPE go_gc_duration_seconds summary
go_gc_duration_seconds{quantile="0"} 0
go_gc_duration_seconds{quantile="0.25"} 0
go_gc_duration_seconds{quantile="0.5"} 0
go_gc_duration_seconds{quantile="0.75"} 0
go_gc_duration_seconds{quantile="1"} 0
go_gc_duration_seconds_sum 0
go_gc_duration_seconds_count 0
...
역시
docker-compose.yml로 실행이 가능하다.$ pwd /Users/gurumee/Workspace/gurumee-book-prometheus/src/part2/ch02 $ docker compose up -d node-exporter ... $ docker ps CONTAINER ID IMAGE COMMAND CREATED STATUS PORTS NAMES c8480fc6f79c b8a614cef113 "/bin/node_exporter" 3 seconds ago Up 2 seconds 9100/tcp node-exporternode-exporter 설치 (서버)
서버 환경에서는 다음과 같이 명령어를 입력하여
node-exporter를 설치할 수 있다.# 현재 위치 확인 $ pwd /home/sidelineowl # 압축 파일 다운로드 $ wget https://github.com/prometheus/node_exporter/releases/download/v1.2.0/node_exporter-1.2.0.linux-amd64.tar.gz # 압축 파일 해제 $ tar -xvf node_exporter-1.2.0.linux-amd64.tar.gz # 압축 파일 삭제 $ rm node_exporter-1.2.0.linux-amd64.tar.gz # 압축 해제된 디렉토리 ~/apps/node_exporter 경로 변경 $ mv node_exporter-1.2.0.linux-amd64 ~/apps/node_exporter # node_exporter 설치된 디렉토리로 이동 $ cd apps/node_exporter/ # node_exporter 실행 $ ./node_exporter ...이제 리눅스 서비스로 등록하자.
$ pwd
/home/sidelineowl/apps/node_exporter

# user 추가
$ sudo useradd -M -r -s /bin/false node_exporter

# 실행 파일 /usr/local/bin/으로 경로 이동
$ sudo cp ./node_exporter /usr/local/bin

# /usr/local/bin/node_exporter node_exporter 유저, 그룹 권한 주기
$ sudo chown node_exporter:node_exporter /usr/local/bin/node_exporter

# 서비스 파일 등록
$ sudo tee /etc/systemd/system/node_exporter.service << EOF
[Unit]
Description=Node Exporter
Wants=network-online.target
After=network-online.target

[Service]
User=node_exporter
Group=node_exporter
Type=simple
ExecStart=/usr/local/bin/node_exporter

[Install]
WantedBy=multi-user.target
EOF

# 데몬 리로드
# sudo systemctl daemon-reload
이후 터미널에 다음을 입력하면
node-exporter를 구동시킬 수 있다.# 서비스 가동 $ sudo systemctl restart node_exporter # 서비스 상태 확 $ sudo systemctl status node_exporter ● node_exporter.service - Node Exporter Loaded: loaded (/etc/systemd/system/node_exporter.service; disabled; vendor pr> Active: active (running) since Tue 2021-07-20 09:32:38 UTC; 5s ago Main PID: 48153 (node_exporter)인 ...그 후 터미널에서 다음 명령어를 입력하여 수집되는 데이터가 있는지 확인한다.
$ curl localhost:9100/metrics
# HELP go_gc_duration_seconds A summary of the pause duration of garbage collection cycles.
# TYPE go_gc_duration_seconds summary
go_gc_duration_seconds{quantile="0"} 0
go_gc_duration_seconds{quantile="0.25"} 0
go_gc_duration_seconds{quantile="0.5"} 0
go_gc_duration_seconds{quantile="0.75"} 0
go_gc_duration_seconds{quantile="1"} 0
go_gc_duration_seconds_sum 0
go_gc_duration_seconds_count 0
...
Prometheus 연동
이제
Prometheus에서node-exporter가 수집하고 있는 메트릭을 스크래이핑 해보자.Prometheus설정 파일을 보면scrape_config밑에 다음과 같이node-exporter관련job이 등록 된 것을 확인할 수 있다.src/part2/ch02/prometheus/prometheus.yml
# ... scrape_configs: # ... - job_name: 'node-exporter' scrape_interval: 5s static_configs: - targets: ['node-exporter:9100']static_configs밑에targets에서node-exporter가 구동된 인슨턴스들의 "IP:9100"을 적어주면,Prometheus가scrape_interval에 설정된 주기마다 각 인스턴스들에서 수집되는 메트릭을 스크래이핑하여 저장한다. 이제 Prometheus`를 구동시켜보자.# local $ docker compose up -d prometheus # server $ sudo systecmctl restart prometheusPrometheus UI에서 다음 쿼리를 입력해보자.up
그럼 다음과 같이 우리가 설정한
node-exporter란job_name으로 수집되고 있는 인스턴스들의 개수를 확인할 수 있다.
Grafana 대시보드 구축
이제
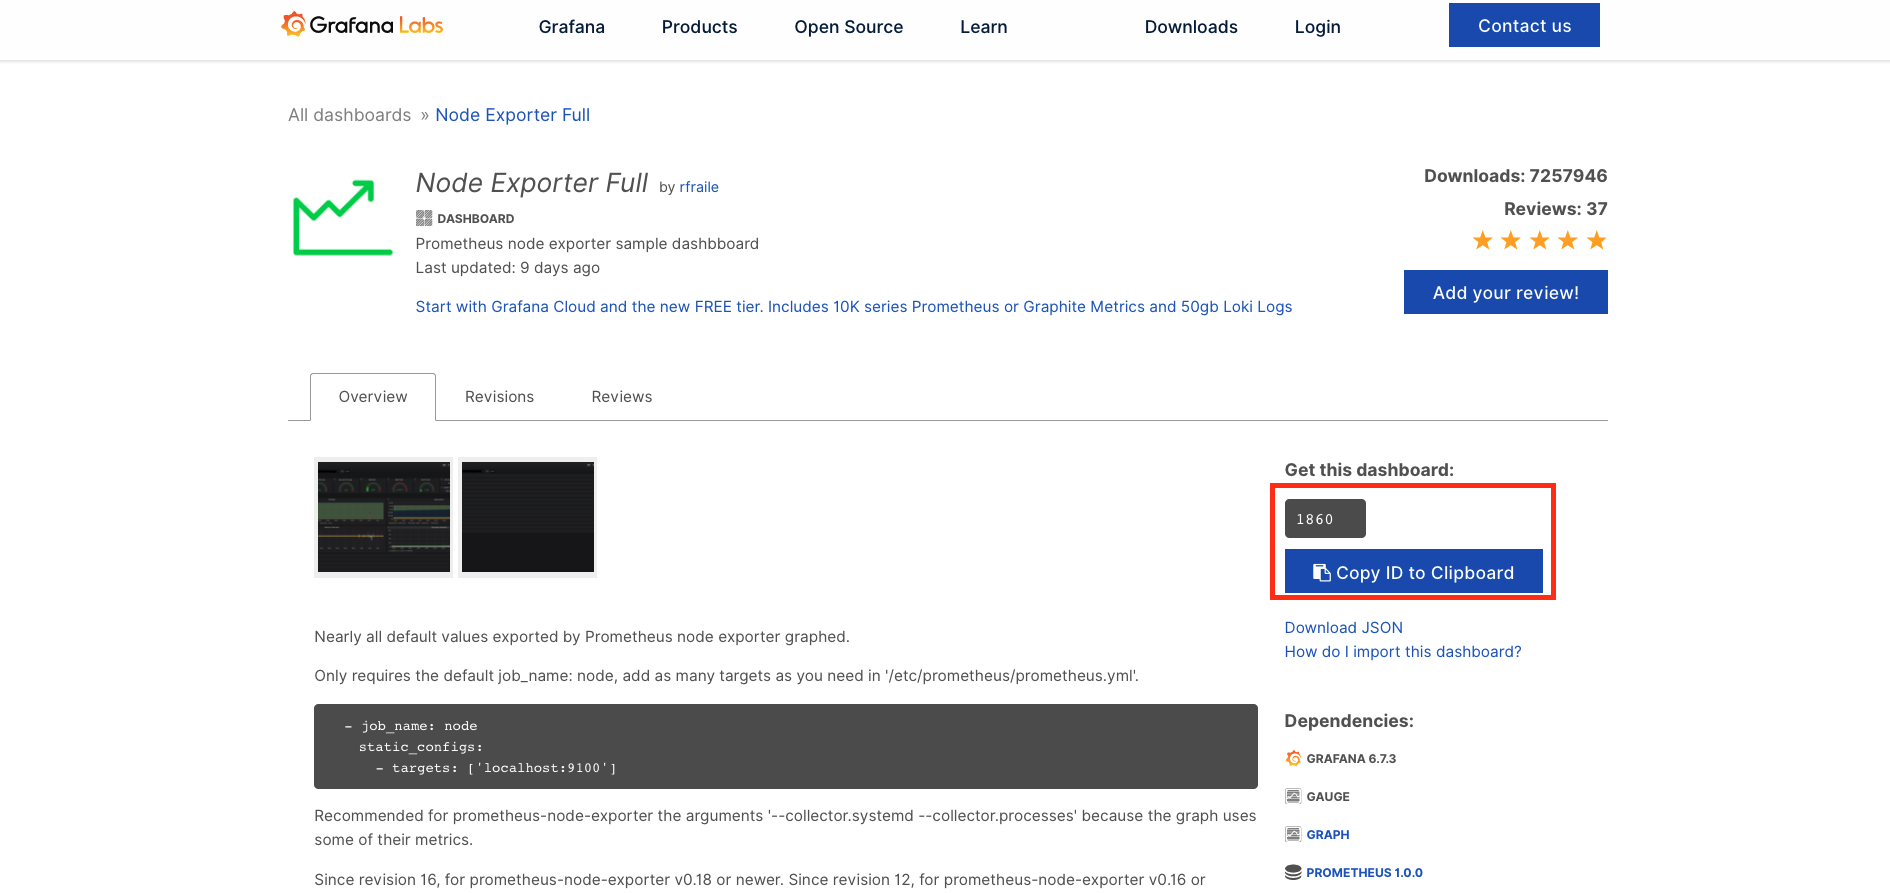
Grafana에서 대시보드를 구축해보자. 먼저 터미널에 다음을 입력한다.# local $ docker compose up -d grafana # server $ sudo systecmctl restart grafana-serverGrafana로 대시보드를 구축할 때 정말 좋은 점은node-exporter같이 많이 사용하는Exporter에 대한 대시보드가 이미 공유되어서 그것을 손쉽게 사용할 수 있다는 것이다. 먼저 다음 경로로 이동한다.그러면 아래 화면이 보이는데 다음을 복사한다.
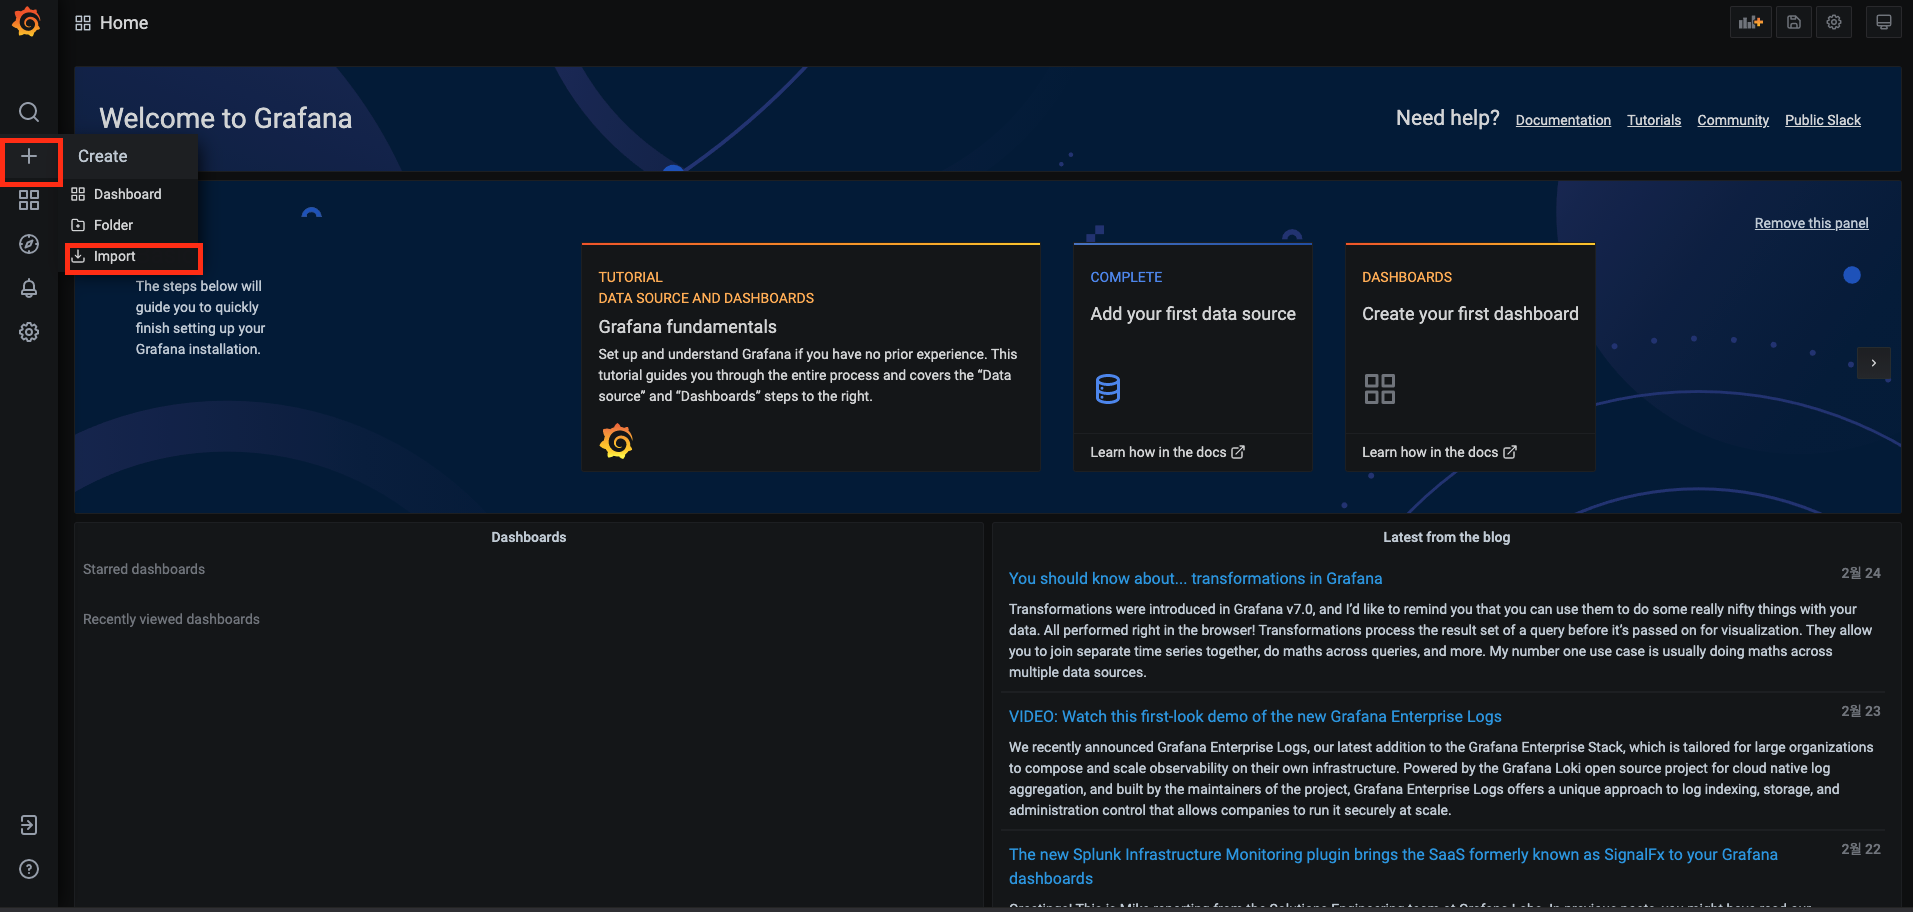
그 후 대시보드로 이동한 후, 왼쪽 탭의 두 번째 "+"의 "Import" 메뉴를 클릭한다.
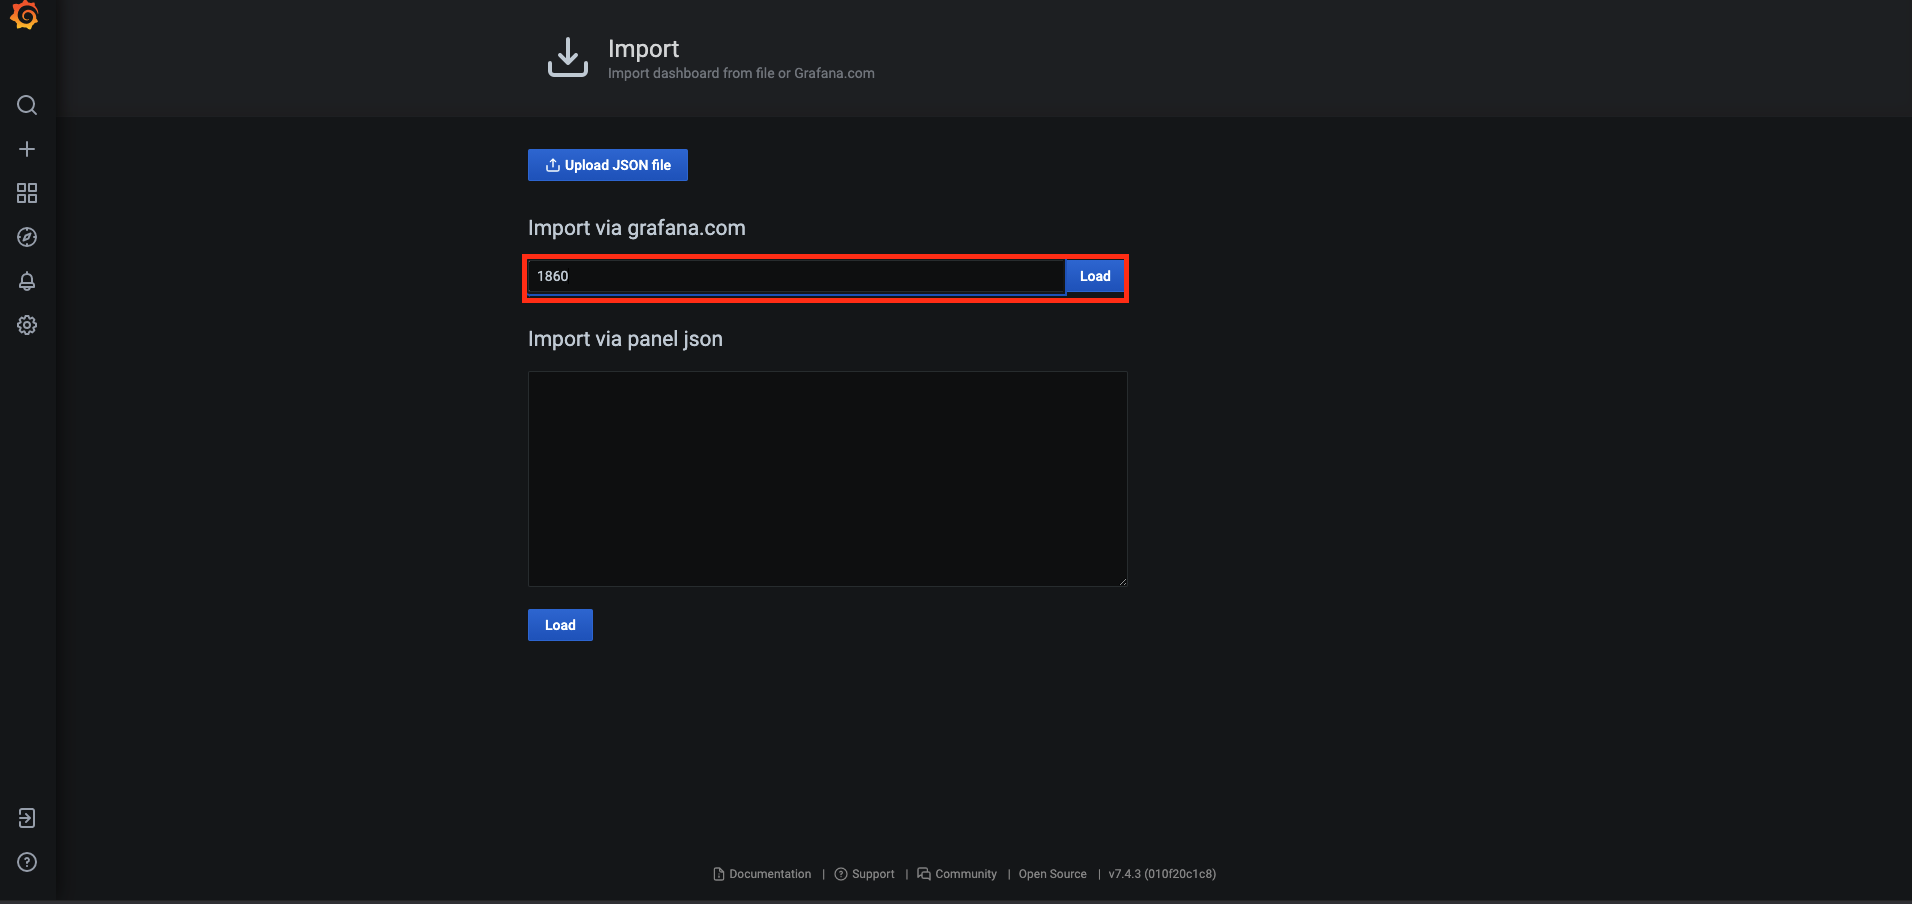
그러면 다음 화면에서 아까 복사한 대시보드 ID를 입력하고 "Load" 버튼을 누른다.
그 후 "Datasource"에서 "Prometheus"를 선택한 뒤 "Import"를 누른다.
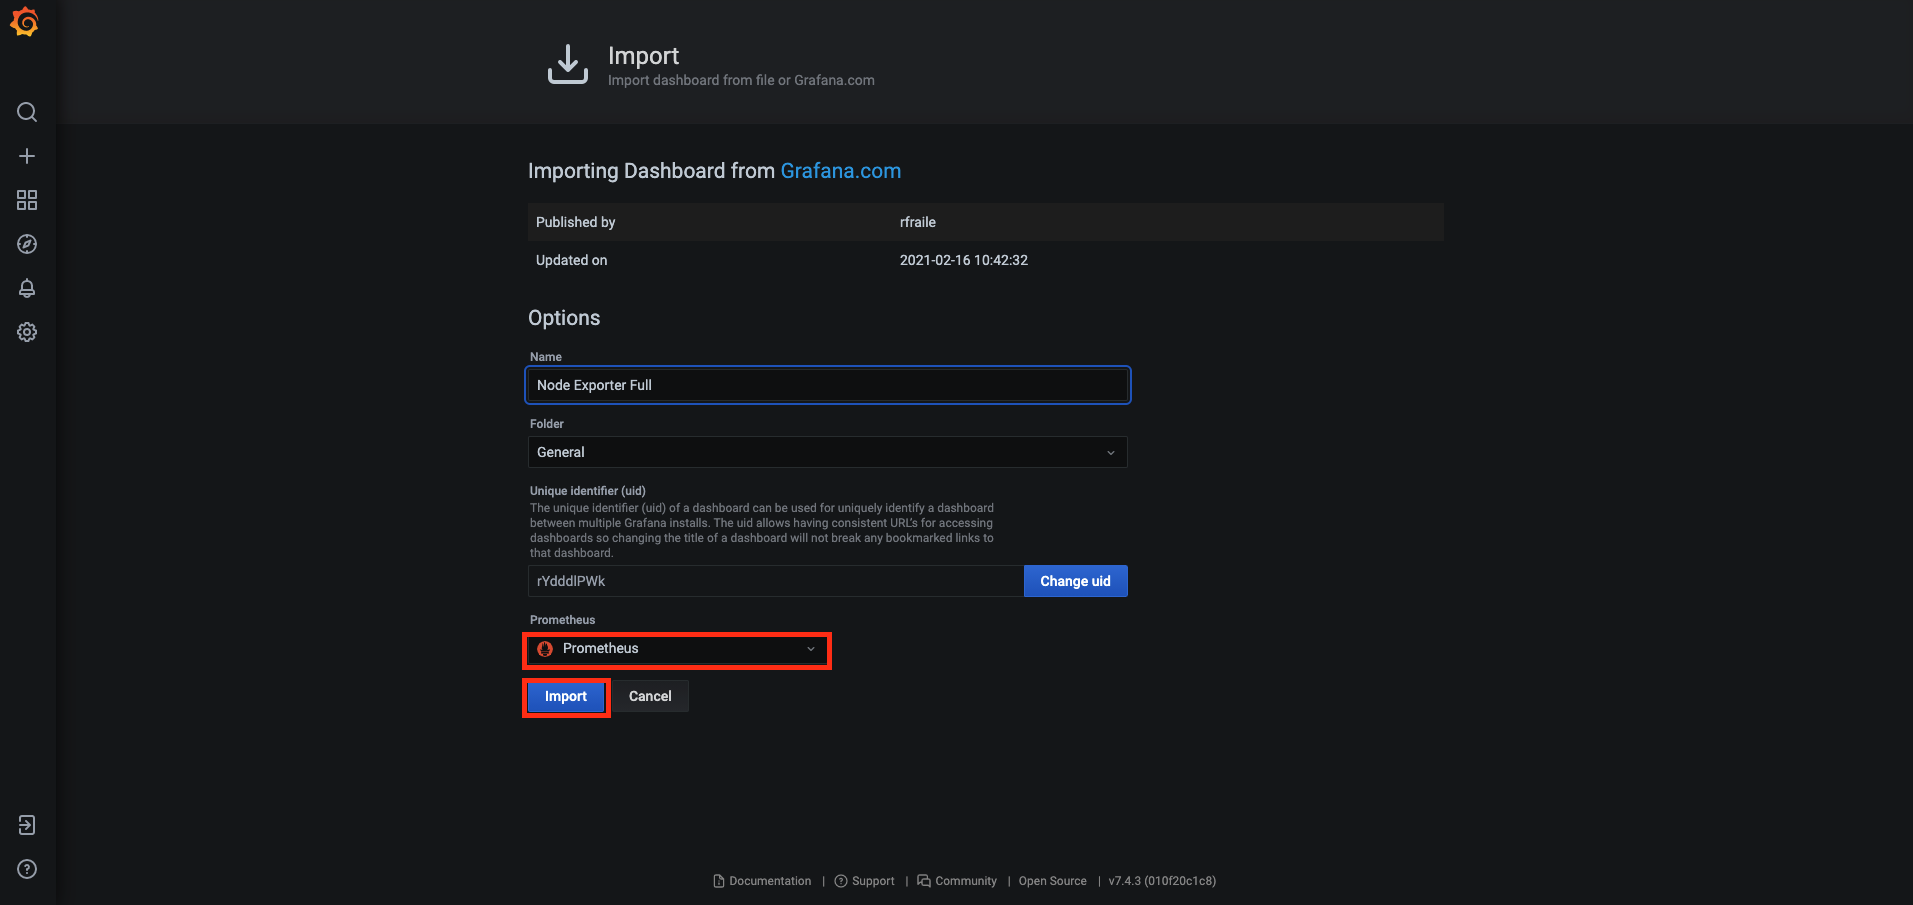
그럼 다음 화면이 보인다.
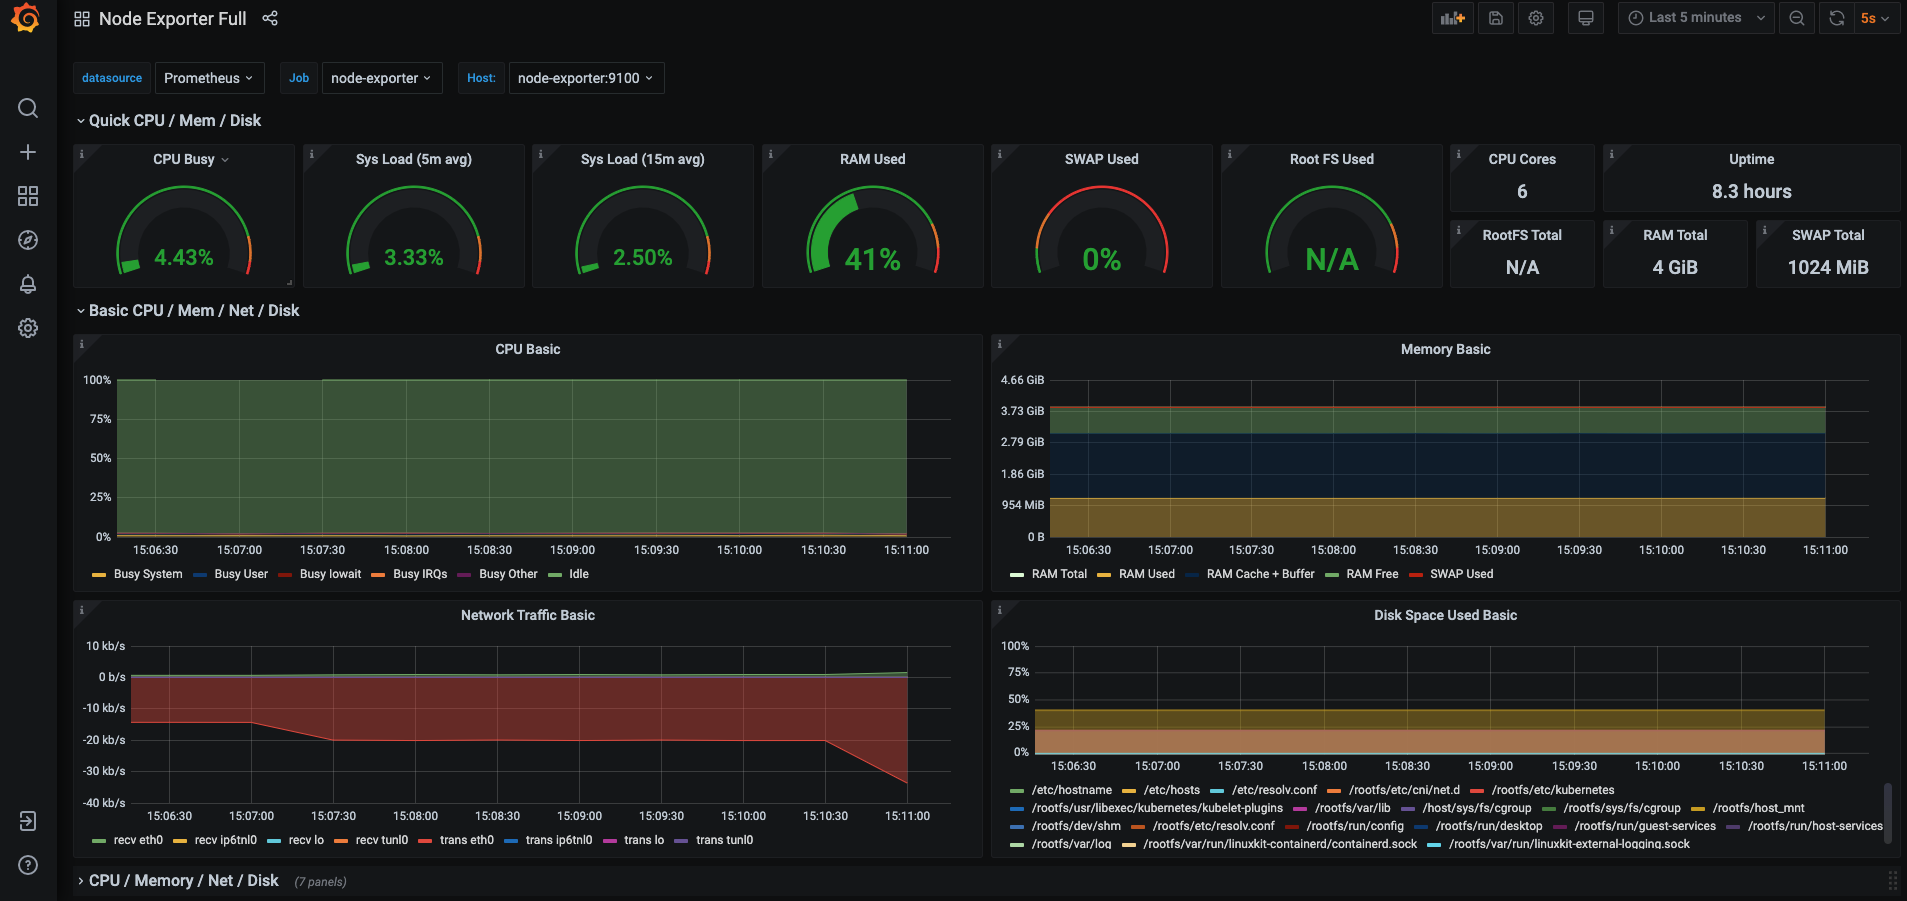
기본 설정된 값으로는 잘 안보일 수 있으니 우측 상단 메뉴에서 "Last 5 Minutes"를 설정하고, 리프레시 간격을 5s로 바꾸는 것이 좋다. 실 서버에서는 서버 부하가 걸릴 수 있으니 15분에 10초가 적당하겠다.
이 대시보드에서 우리가 확인할 수 있는 지표들은 크게 다음과 같다.
- CPU
- Memory
- Disk
- Network
- File System
- System Daemon
- Node Exporter
이는 대시보드에서 확인할 수 있으니 한 번 확인해보길 바란다. 각 패널마다
edit을 누르면,Grafana에서Prometheus를 어떻게 쿼리하는지 살펴볼 수 있다. 눈에 익도록 한 번씩 살펴두는 것이 좋다.728x90반응형'레거시 > Metric' 카테고리의 다른 글
서비스 메트릭 모니터링하기 (1) prometheus-nginxlog-exporter (0) 2021.03.04 시스템 메트릭 모니터링하기 (2) collectd-exporter (0) 2021.03.02 Grafana란 무엇인가 (0) 2021.02.25 자바 어플리케이션 모니터링하기 (1) spring-boot (0) 2021.02.22 Prometheus란 무엇인가 (0) 2021.02.19